Two AI systems: one watches, one estimates
Infra AI is where we put artificial intelligence to work on the built environment — monitoring the buildings you already operate, and measuring the ones you have not built yet.
Two systems, opposite ends of a building's life.
Asset & Power Monitoring System
For the building already standing. Meters every board, watches every lift, pump and chiller, and puts the whole site on one dashboard you can open anywhere.
See the systemTogal.AI
For the building still on paper. AI reads the drawing set and detects, measures and compares the quantities, so the estimator checks the numbers instead of tracing them.
See the platformAsset & Power Monitoring System
Smart building monitoring, from data to insight. One connected system for electrical power and critical assets, from the sensors on the board to the dashboard in your pocket.
From data to insights — a connected, intelligent building.
Five stages, each one standard hardware or standard protocol. Nothing in the chain locks you to a single vendor.
-
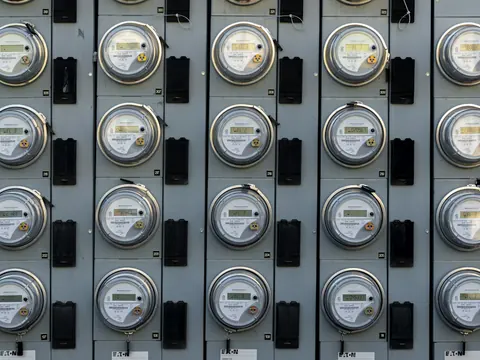 Field sensors & meters — power meters and CTs,
environmental sensors, equipment sensors and other building systems,
fitted across your electrical and building assets.
Field sensors & meters — power meters and CTs,
environmental sensors, equipment sensors and other building systems,
fitted across your electrical and building assets.
-
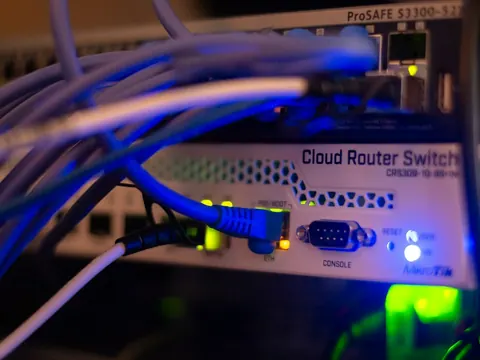 IoT gateway / data logger — collects and converts
protocols on site, processes locally, transmits securely and keeps
storing when the link drops.
IoT gateway / data logger — collects and converts
protocols on site, processes locally, transmits securely and keeps
storing when the link drops.
-
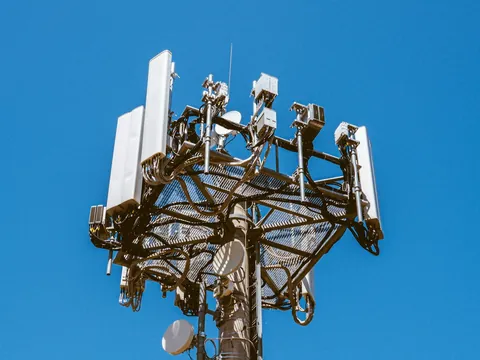 Communication — Wi-Fi, 4G/5G or Ethernet,
carried over MQTT or HTTPS.
Communication — Wi-Fi, 4G/5G or Ethernet,
carried over MQTT or HTTPS.
-
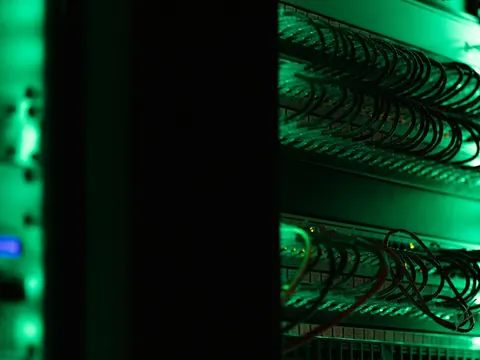 Cloud platform — secure server, real-time storage,
analytics and scalable infrastructure, reachable from anywhere.
Cloud platform — secure server, real-time storage,
analytics and scalable infrastructure, reachable from anywhere.
-
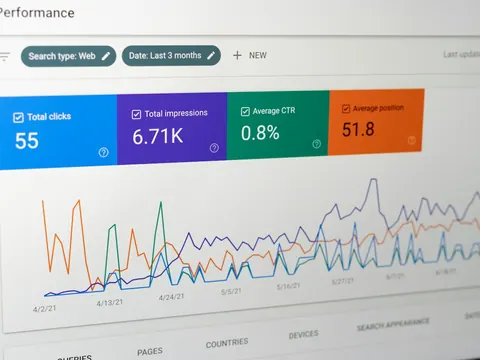 Web & mobile dashboard — real-time monitoring,
alerts and notifications, reports and analytics, multi-user access,
on desktop and phone alike.
Web & mobile dashboard — real-time monitoring,
alerts and notifications, reports and analytics, multi-user access,
on desktop and phone alike.
Comprehensive electrical monitoring for better energy management.
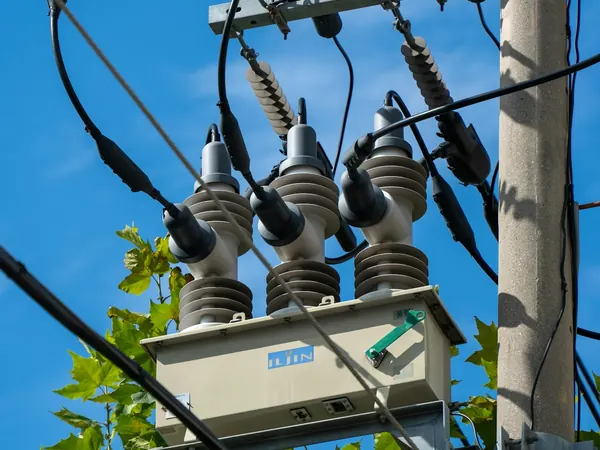 Main incoming supply (TNB / substation)
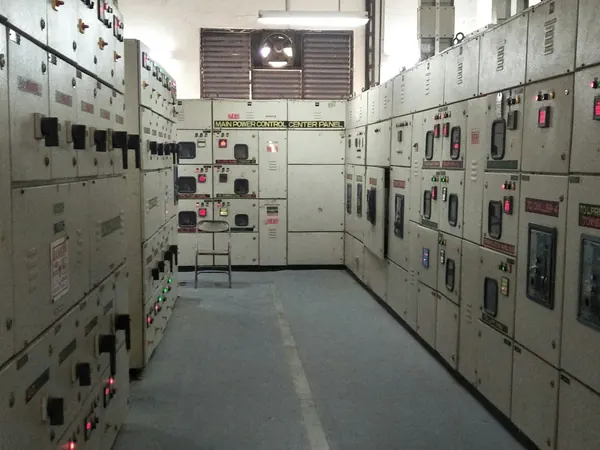 MDB / SMDB / DB distribution boards
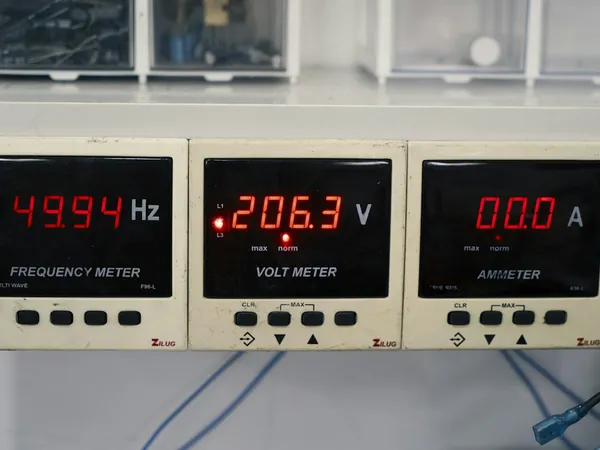 Smart power meter with CTs
Key parameters
- Voltage (V) and current (A)
- Power (kW) and energy (kWh)
- Power factor (PF)
- Frequency (Hz) and demand (kW)
- Harmonics and power quality
Sub-metering by
- Floor
- Tenant
- Zone or area
- Major equipment — HVAC, lifts, pumps
Detect & alert
- Abnormal consumption
- Overload and overcurrent
- Voltage abnormality
- Low or high power factor
- Harmonics and power quality issues
- Equipment trip or failure
- Custom alert settings
Keep your building assets running safely and efficiently.
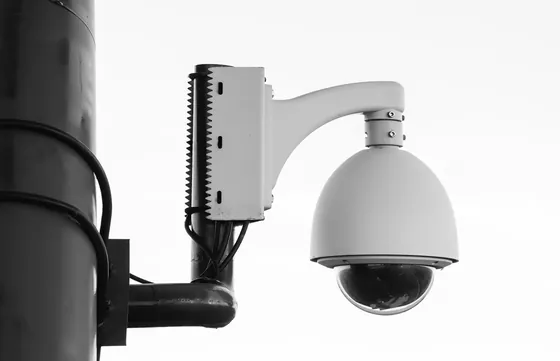 CCTV Systems
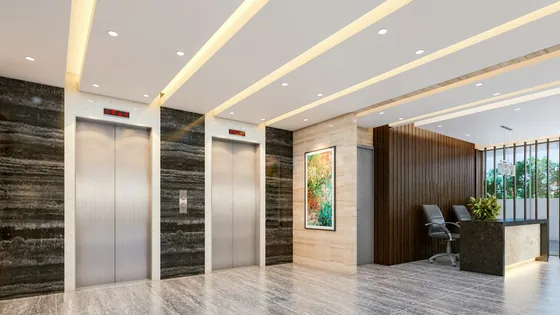 Lifts & Elevators
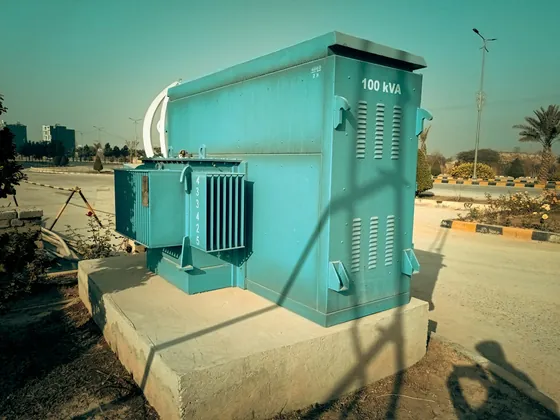 Generators
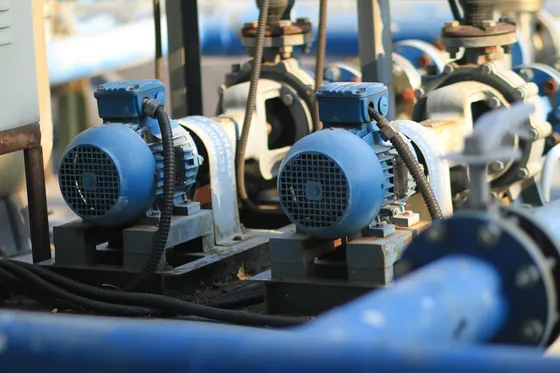 Water Pumps
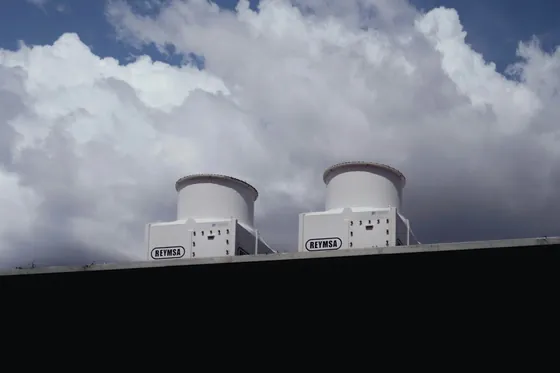 HVAC / Chillers / AHU
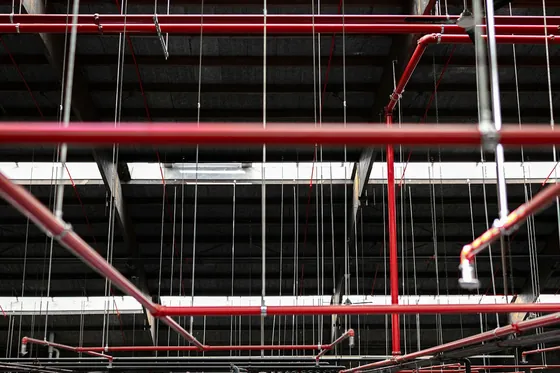 Fire Pumps
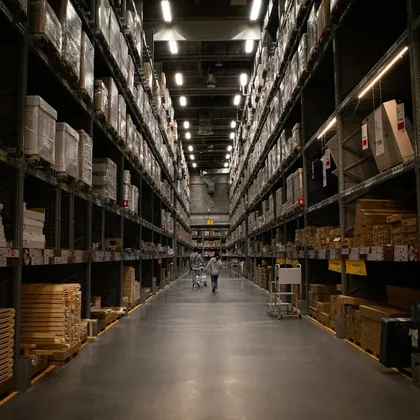 Lighting Systems
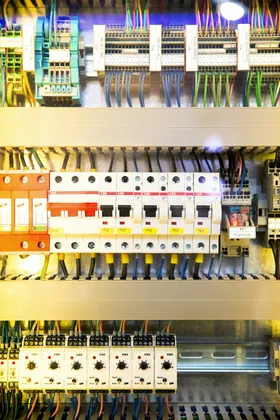 Panels & Switchboards
 Other Critical Equipment
What the system records per asset
Every asset carries the same record, so a lift and a fire pump are read the same way — and a fault on either one reaches you through the same alert.
- Operating status (on / off)
- Runtime and operating hours
- Temperature and vibration, where applicable
- Fault and trip status
- Maintenance records
- Alerts and notifications
Real-time insight for smarter building management.
Sample view — Wisma Harta building monitoring system, 1–30 September 2026.
Energy by floor
| Area | Share of consumption |
|---|---|
| Level 1 | 28% |
| Level 2 | 22% |
| Level 3 | 18% |
| Car park | 16% |
| Others | 16% |
On the dashboard
Electrical load trend, energy split by floor, live asset count and open alerts — the same six views on desktop and on the phone in your pocket.
- Dashboard — the building at a glance
- Electrical — boards, meters and power quality
- Assets — status, runtime and maintenance
- Reports — consumption and analytics
- Alerts — what needs attention now
- Settings — users, thresholds and notifications
Turn data into a smarter, greener tomorrow.
Real-time monitoring
Electrical and asset data as it happens, across the whole building rather than one board at a time.
Energy management
Consumption broken down by floor, tenant, zone and equipment, so savings can be aimed rather than guessed.
Asset tracking
One central record of every critical asset, its runtime and its maintenance history.
Fault alerts
Trips, overloads and abnormal conditions raise a notification the moment they are detected.
Preventive maintenance
Runtime hours and fault history turn servicing into a schedule instead of a reaction.
Reporting & analytics
Consumption, demand and asset reports ready for management, tenants and ESG reporting.
Five things a facility team stops doing by hand.
- Better visibility of electrical consumption across the building
- Faster detection of abnormal conditions and potential issues
- Centralised asset records for more efficient facility management
- Maintenance planning supported by real runtime data, reducing downtime
- Data-driven decisions that improve energy efficiency and lower operating costs
Togal.AI — AI takeoff for pre-construction
Where the monitoring system watches a building that already exists, Togal.AI works on the one you are still pricing.

Measured from the drawing, not by hand
Togal.AI reads a digital plan set and detects, measures and compares the areas on it automatically. The estimator stops tracing and starts checking — the quantities arrive, and the judgement stays with the person.
What it does
Togal Button
One press and the AI handles the clicking and counting that used to take an estimator hours or days.
AI-driven search
Draw a box around one symbol and it finds and counts every other instance of it, by image, text or pattern.
Instant labels
Upload a plan set and it names and organises the whole thing in seconds, instead of someone renaming sheets all morning.
Real-time collaboration
Plans, changes and markups live in one place, so a team in three offices is working on one set rather than four.
Togal Chat
A built-in takeoff assistant: ask it questions about the plans, verify quantities, catch errors and draft RFPs.
Data export
Quantities go straight out to your estimating software or to a spreadsheet, so the takeoff is not trapped in the tool.
See it run
Full live demo — a complete takeoff, start to finish.
An MEP takeoff in under four minutes — the closest to our own work.

Want to try it on your own drawings?
Togal.AI is a separate platform, built and operated by Togal.AI. Talk to us about how it fits your pre-construction workflow, or go straight to the source for pricing and a self-guided tour.
Togal.AI and Togal Chat are trademarks of Togal.AI. Figures quoted on this page are the vendor's own published claims.
Start with either one.
A building to monitor, a project to price, or both. Tell us which and we will come back with the scope, the counts and what it takes to get you going.